
The Components Approach
A structured method for making complex policy problems manageable.
Public agencies face problems that are urgent, high-stakes, and structurally complex. This guidebook introduces a methodology for decomposing broad, persistent challenges into distinct, measurable sub-problems that can be targeted with specific interventions, tracked with appropriate metrics, and governed through a connected operating system.
The Problem — and Why It Stays Unsolved
Why well-resourced systems still struggle to close persistent gaps.
Public education agencies are asked to solve problems that are urgent, high-stakes, and structurally complex — educator shortages, inequitable access to effective instruction, persistent disparities in outcomes, and uneven program performance across contexts. These problems often persist not because leaders are indifferent or because there is no activity in the system, but because the way the problem is framed and managed does not match the way the problem actually exists on the ground.
The Implementation Dilemma
The fundamental challenge was named by Cohen, Moffitt, and Goldin (2007): policies aim to solve problems, yet the key problem solvers are those who have the problem. Policymakers must craft solutions while relying on the very institutions experiencing those problems to implement them. Those instruments help only if used well by those with the problem — whose capacity is often weakest precisely where need is most acute.
This dilemma manifests across public administration. Programs that appear well-designed at the state or federal level frequently fail to reach the communities that prompted them. When solutions are designed and distributed broadly, aggregate statistics can look acceptable while severe gaps persist in specific places, roles, or populations. The organizations most in need of support often lack the administrative infrastructure to access improvement programs, while better-resourced entities are positioned to apply for competitive grants — even when their need is comparatively mild.
The core mismatch: the unit at which problems are diagnosed is almost never the unit at which they are experienced. Closing that gap is what the Components Approach is designed to do.
Strategy as Conversation, Not System
When problems are managed at the wrong unit of analysis, strategy becomes a recurring conversation rather than an operating system. Meetings repeat. Initiatives accumulate without clear ownership. Measurement either becomes too high-level to guide action — tracking statewide averages that obscure local variation — or too close to activity to reveal whether underlying conditions are changing.
The absence of structured decomposition means each planning cycle revisits the same headline numbers, proposes broad statewide interventions, and distributes resources through competitive mechanisms that reward grant-writing capacity rather than demonstrated need. Over time, even well-funded systems can remain stuck: always active, rarely improving where improvement matters most.
Teacher Shortages: The Wrong Question
Educator shortages illustrate this clearly. School districts have reported significant teacher shortages that intensified following the COVID-19 pandemic, with record-high numbers of teachers leaving the profession during and after the pandemic — disproportionately affecting students from low-income families and marginalized communities who often bear the heaviest burden of these shortages (Carver-Thomas et al., 2021).
Yet aggregate data reveal a more complex picture. While education leaders across the country consistently report difficulty filling teaching positions, labor economists have presented evidence suggesting the issue is more complicated than simple widespread shortage. Studies indicate that the United States actually produces more educators than its student population requires (Goldhaber & Theobald, 2016), with some experts finding evidence of teacher surpluses in certain areas (Aldeman, 2016; Antonucci, 2016). The paradox deepens given that many certified teachers struggle to secure classroom positions (Goldhaber et al., 2022), while declining public school enrollment trends suggest workforce reductions may be approaching in some regions (Dee, 2022).
To reconcile reported shortages with an apparent oversupply of qualified teachers, it helps to recognize that shortages do not occur uniformly across state or national levels. As Dee and Goldhaber (2017) demonstrate, teacher shortages stem primarily from specific school and subject characteristics. An elementary school serving low-income families in South Chicago might struggle to retain teachers — a challenge shared by similar schools in Southern Los Angeles — while a school in Chicago's affluent suburbs may face no such difficulty. The same pattern emerges with specialized positions: rural schools in Nebraska's western panhandle and Maryland's Eastern Shore often struggle to recruit bilingual teachers, while urban centers like Omaha report no such problem.
Reporting shortages at the state level aggregates these distinct local contexts into a summative statistic that fails to capture localized experience. State data can simultaneously indicate a fully staffed workforce while masking significant staffing challenges in specific places — even showing teacher dismissals and shortages existing side by side within the same system. The most important questions are rarely just "How many?" but "Who is affected, where is the constraint, and what does the system need to do differently here?"
A Parallel in Public Health
The same implementation failure appeared in COVID-19 vaccination programs. Research shows that populations facing the highest COVID-19 risk were often among the last to receive vaccines after initial distribution (Jones et al., 2022; Matrajt et al., 2020). When central authorities distributed vaccination strategies broadly at the state or county level, they frequently failed to reach the most vulnerable communities because the strategies did not account for local implementation constraints.
Rural areas with limited healthcare infrastructure and higher rates of vaccine hesitancy received vaccines later than urban centers (Murthy et al., 2021). Racial and ethnic minority groups, disproportionately exposed to COVID-19 risk, encountered significant barriers to access (Cuadros et al., 2022). Aggregate coverage statistics could look reasonable while masking stark disparities between communities that far exceeded the average and those that fell far below it. Mobile vaccination programs eventually emerged as targeted corrections (Alcendor et al., 2022; Ketel, 2023) — but only after the initial broad-based strategies had already revealed the mismatch between policy intent and implementation reality.
The parallel to educator shortages is direct. Knowing a state had administered millions of vaccine doses provided limited insight into whether vulnerable populations were protected — just as knowing a state had 5,300 teacher vacancies provides limited insight into which students lack access to qualified teachers and which schools face persistent staffing challenges.
How the Mismatch Plays Out
When districts experience staffing difficulties, states typically respond by developing broad strategies aimed at addressing the shortage. These strategies, however, are usually distributed uniformly across the entire state, regardless of where the original staffing challenges occurred. This standardized distribution approach results in a mismatch between resources and need: districts experiencing the most severe staffing challenges may lack the capacity to effectively implement or access the state's proposed solutions, while districts with adequate staffing receive support they did not need. The result is an inefficient allocation of resources that can perpetuate the original staffing problems in the very areas most affected.
This cyclical pattern is particularly evident in education, where districts with the greatest needs often have the least administrative capacity to leverage state-level support programs (Mizrav & Lachlan-Haché, 2021). It mirrors the broader implementation dilemma: those most in need of assistance are often least equipped to access or implement the very solutions designed to help them.
Three Structural Reasons the Gap Persists
Wrong unit of analysis
Plans built on statewide averages miss the local patterns where problems are actually experienced. Implementation can reach the whole state while bypassing the specific districts, schools, and populations that generated the original concern.
Resources flow to capacity, not to need
Competitive grant mechanisms and broad program access requirements systematically advantage entities with stronger administrative infrastructure. Districts with the most severe shortages are often those least equipped to apply for and manage the programs designed to address them.
Measurement operates too high to guide action
When performance monitoring tracks only statewide totals, it becomes impossible to determine whether a specific program is reaching its intended population, whether a particular dimension of the problem is improving, or whether resources should be redirected. The feedback loop between action and outcome is broken.
These three structural causes reinforce each other. Diagnosis at the statewide level produces broad strategies; broad strategies flow to high-capacity recipients; high-capacity recipients are measured against statewide averages that may already look adequate. The cycle repeats without any mechanism to surface the local concentrations that prompted the original concern.
What the Components Approach Addresses
The Components Approach is a direct response to all three structural causes. It reorients the unit of analysis from the statewide headline to the specific, verifiable sub-problems that constitute it. It changes how resources are targeted — from broad competitive distribution to component-specific deployment. And it restructures measurement to track whether the right conditions are changing, not just whether activity is occurring. The remainder of this guide introduces a way to address that mismatch by making the system visible enough to manage: decomposing broad challenges into distinct, measurable sub-problems, tracked with the right metrics, and governed through a connected operating system.
What Is a Component?
The unit of analysis that makes a complex problem manageable.
Definition. A component is a precise, verifiable, data-informed statement that specifies who is affected, where in the system the inequity occurs, what policy or practice drives it, and what action can address it. A component is a problem statement you can manage: specific enough that a team can (a) see it in data, (b) connect it to a plausible set of strategies, and (c) know what evidence would change its assessment over time.
A component is not a theme, a category, or a restatement of the headline problem. It is a verifiable claim that names a specific population, locates the problem in a specific part of the system, identifies a plausible driver, and implies a concrete management decision. If a statement cannot be connected to an action, it is either too broad or not yet sufficiently evidenced to be a component.
Four Criteria for a Well-Formed Component
Visible in data
Grounded in a pattern consistent across administrative records, survey data, or program outcomes — not an assertion, but a finding that recurs across years and contexts.
Specifies who and where
"Teacher shortages are a problem" fails this test. "Early-career attrition is concentrated among Black teachers in high-vacancy districts" passes it.
Connected to a lever
Maps to at least one policy or program lever that could plausibly change the condition. Components without levers are observations; components with levers are targets.
Monitored over time
Implies a metric — something trackable that would change if the condition improved, visible at the component level, not only in the aggregate.
Illinois Examples: From Aggregate to Component
Illinois' treatment of its 5,300-position educator shortage demonstrates component formation in practice. The aggregate figure was treated as an entry point, not a strategy. Decomposition revealed five distinct components:
Candidates enrolled in Illinois' educator preparation programs are less racially and ethnically diverse than undergraduate students at Illinois institutions of higher education overall. A measurable disparity between two defined populations — implying targeted pipeline interventions, not general diversity statements.
Teacher vacancies are especially high in 39 entities with a vacancy rate exceeding 10% and at least 5 vacancies in both 2023 and 2024. Names a specific set of districts and enables direct resource targeting without competitive application.
Illinois experienced 3,532 unfilled positions in fall 2023; special education, STEM, elementary, physical education, and bilingual education accounted for more than 75% of them. Implies targeted credential and preparation interventions.
Attrition is highest for early-career Black teachers (4) and for Black teachers across all experience levels (5). A demographic intersection aggregate retention statistics obscure entirely — implying mentoring and induction support.
What a Component Is Not
| Not a component | Why it fails | Revised as a component |
|---|---|---|
| Illinois has a teacher shortage. | Restates the headline. No population, location, driver, or lever. | Vacancy rates exceed 10% in 39 specific entities in both 2023 and 2024. |
| Diversity in the teacher workforce needs to improve. | A general aspiration with no measurable gap or implied action. | Preparation program enrollment is less diverse than the broader undergraduate population at Illinois institutions. |
| Rural recruitment is challenging. | Too vague — what population, geography, or measure of challenge? | Rural districts under 500 students report the highest open-position-to-applicant ratios for bilingual and STEM credentials. |
Why Reverse-Engineer?
Starting from outcomes and working backward to their distinct drivers.
The conventional policy planning sequence moves forward: a problem is identified, a strategy is selected, programs are designed, and implementation begins. The difficulty is that this sequence typically starts from a high-level problem statement — a statewide shortage number, an aggregate outcome metric — and works toward solutions before disaggregating the problem into its constituent parts. The result is strategies built to address an average that may not describe any specific community's actual experience.
The Components Approach reverses this sequence. It begins with the outcome decision-makers are accountable for and works backward — asking what distinct, separately measurable conditions would need to change for that outcome to improve. Rather than selecting a strategy and hoping it reaches the right population, the methodology first identifies the specific populations and conditions that constitute the problem, then designs strategies that address those drivers. The practical move is to start from the outcome and trace backward to the drivers.
What Changes When You Reverse-Engineer
Prioritization becomes possible
Distinct components allow a team to identify where effort has the most leverage — which concentrations are largest, which populations most severely affected, which conditions show the least improvement over time.
Resource targeting becomes direct
Illinois' $45 million Teacher Vacancy Grant was routed specifically to the 39 high-vacancy districts identified through component analysis — not distributed broadly where application capacity is highest. No competitive application required; the component determined the recipient.
Strategy differentiation becomes necessary
Illinois initially invested heavily in Grow Your Own programs for its largest urban areas, assuming recruitment was the primary bottleneck. Component analysis revealed rural districts faced the most severe recruitment challenges while urban areas struggled mainly with retention — two different problems requiring different responses.
Evaluation becomes tractable
Attributing statewide change in aggregate metrics to any specific program is often analytically unrealistic. Component-level monitoring tracks whether the right conditions are changing — independent of whether the top-line number has shifted yet.
The Components Framework
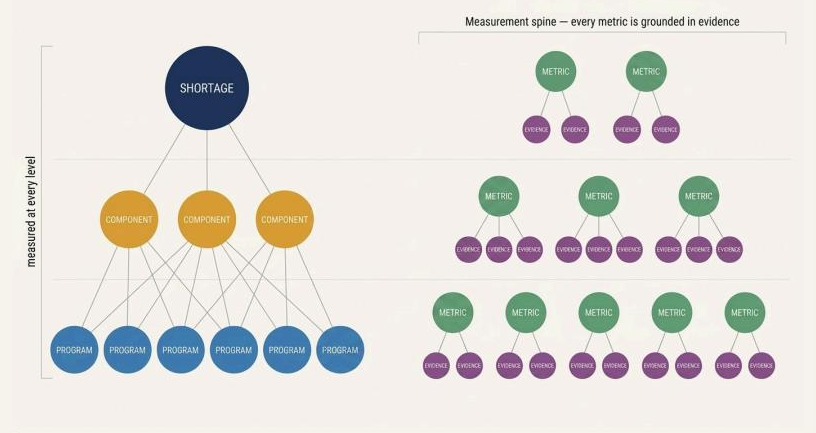
The methodology represents the diagnosis as a structured tree: the shortage at the top, the components that constitute it in the middle, and the concrete programs and policy levers that act on each component at the base. The structure is measured at every level, and every metric is anchored to evidence.
Drafting the Data Story
How a components perspective structures analysis into decisions.
The "data story" in a components system connects three things: what is observed in the data, what drives the pattern, and what the system will do about it — at a level of specificity that supports implementation, not just reporting. A single statewide storyline will almost always be too blunt. A components perspective builds the story by systematically locating structure within the data.
- 1
Identify the headline outcome and why it matters
Start with the problem leadership is accountable for: unfilled positions, out-of-field assignments, early attrition, or access disparities. The headline orients the team before decomposition begins — it is the entry point, not the analysis.
- 2
Disaggregate until persistent patterns become visible
Break the headline by role, place, career stage, and subgroup. The goal is to surface persistent patterns rather than noise — concentrations that recur across years and contexts, revealing which reality a given district or school actually lives.
- 3
State components as verifiable claims
Draft each component as a testable statement precise enough for a team to plausibly manage. Each claim specifies the affected population, system location, driver, and implied action.
- 4
Connect components to levers and evidence
Identify the policy and program levers that could plausibly move each component, and the evidence framework that would signal whether conditions are changing: What would we observe if this component were improving?
Three Properties of a Usable Component
Visible in data
Each component is grounded in a pattern that appears consistently across administrative records, survey data, or program outcomes — a finding, not an assertion.
Connected to levers
Every component maps to at least one policy or program lever that could plausibly change the condition — the basis for resource decisions.
Monitored over time
A multi-level approach tracks strategy- and component-level measures, since attributing statewide change to one program is often unrealistic.
From Diagnostic to Managerial
The critical shift is that the data story is not only diagnostic — it is managerial. Once Illinois articulated its components, it built targeted strategies and funding aligned to distinct needs.
Multi-Level Monitoring
The Components Approach enables evaluation at three distinct levels: metrics for specific strategies assess effectiveness against a targeted component; component-level measurements track whether combined strategies are moving that aspect of the challenge; and state-level indicators provide a broader view of overall progress. Early evidence from Illinois shows why this matters — while overall statewide vacancy rates remained stable, the component framework revealed reduced attrition among early-career teachers in specific areas, improvements that would have been invisible inside the aggregate number alone.
Rethinking Cost Effectiveness
How a components lens changes the calculus of program investment.
Standard cost-effectiveness analysis asks whether a program produces measurable outcomes per dollar spent. The Components Approach surfaces a prior question: whether the program is reaching the population whose outcomes it is designed to change. A program can appear effective for its participants while being irrelevant to the original problem if it draws participants from populations not implicated in any component.
Component-based investment analysis asks how each program maps onto the identified component set, what share of the affected population it reaches, and what would change at the component level if the program worked at scale — exposing cases where significant investment has no plausible path to moving the conditions driving the headline problem. Illinois' Teacher Vacancy Grant illustrates the logic: routing $45 million directly to the 39 identified high-vacancy districts meant the targeting mechanism was built into the allocation itself — the component list was the recipient criteria, eliminating the administrative cost of identifying need at the point of application. Other components drove equally specific spend: subject-specific shortages (Component 3) funded targeted grants for special education and bilingual preparation; early-career attrition (Component 4) funded in-building and virtual mentoring; Black teacher retention (Component 5) funded dedicated coaching and support groups. Each dollar traces to one component, not to the 5,300 headline figure.
Three Mechanisms, One Discipline
Targeted implementation
Rather than deploying one-size-fits-all solutions, the approach designs interventions that specifically address local contexts and needs — rural recruitment looks different from urban retention.
Equity focus
The approach centers on the end users of public services, ensuring programs reach those most in need rather than those most capable of accessing them through competitive processes.
Implementation monitoring
Precise tracking of program effectiveness allows strategic scaling of what works while maintaining focus on components still requiring intervention.
A noted limitation
The approach's success depends on the availability of granular data and analytical capacity at the state level; political feasibility of targeted interventions may also vary across contexts.
The Operating System
How the Components Approach becomes a system teams can run.
A components analysis does not end at diagnosis. The deliverable is a sequenced operating system — a structure that tells leadership what to address, when, and how, and that preserves the reasoning behind decisions as the evidence base evolves.
We harness the power of Notion, a cutting-edge workspace technology, to apply the Components Approach in practice. Notion lets us turn the abstract framework into a living, connected system: every component, program, metric, evidence source, and decision is stored in one place, linked together, and updated as the work progresses. The result is not a static report but a working environment that teams can actually run.
- Level 1Shortage
- Level 2Components
- Level 3Programs
- Level 4Metrics
- Level 5Evidence
- Level 6Decide
Components function as the management layer: each component record describes the problem, how it is evidenced, and what it implies about where program design should change. Programs are evaluated not against the statewide headline but against the component(s) they plausibly affect. The metrics layer uses multi-level monitoring — strategy-level, component-level, and broader indicators. The evidence layer keeps sources attached to each claim: measurement is a traceable argument, not a number in isolation. Decisions are logged and revisited on a defined cycle; the system functions as a learning infrastructure, not a filing cabinet.
Have a headline number that isn't moving?
We help agencies decompose broad, persistent challenges into distinct, measurable components — and build the operating system to manage them.
The Operating System, In Practice
Inside the workspace that runs the connected chain.
Section 05 described the connected chain as a structure: shortage, components, programs, metrics, evidence, and decisions, each link traceable to the next. The pages that follow show that structure as a working system rather than a diagram. Each screen below is drawn from the same workspace, organized so that every level of the chain has its own record, its own properties, and its own place in a fixed set of linked databases.
Nothing on these pages is a mockup. The names attached to components, programs, and metrics are placeholders — the workspace shown is a template, populated with sample records so the structure can be inspected before real data is entered.
From Framework to Workspace
The figure below restates the components framework introduced in Section 02, paired with its measurement spine: every metric in the system traces back to the evidence that supports it. The accent colors carry through directly — gold for components, green for metrics, purple for evidence — so the workspace pages that follow can be read against this same map.
Entry Point & System Map
The workspace opens to a single master page that surfaces the goals, efforts, cost, metrics, and resources tied to the workforce strategy. Beneath it sits a fixed set of linked databases — one for each layer of the chain — that every other page in the workspace reads from and writes to.
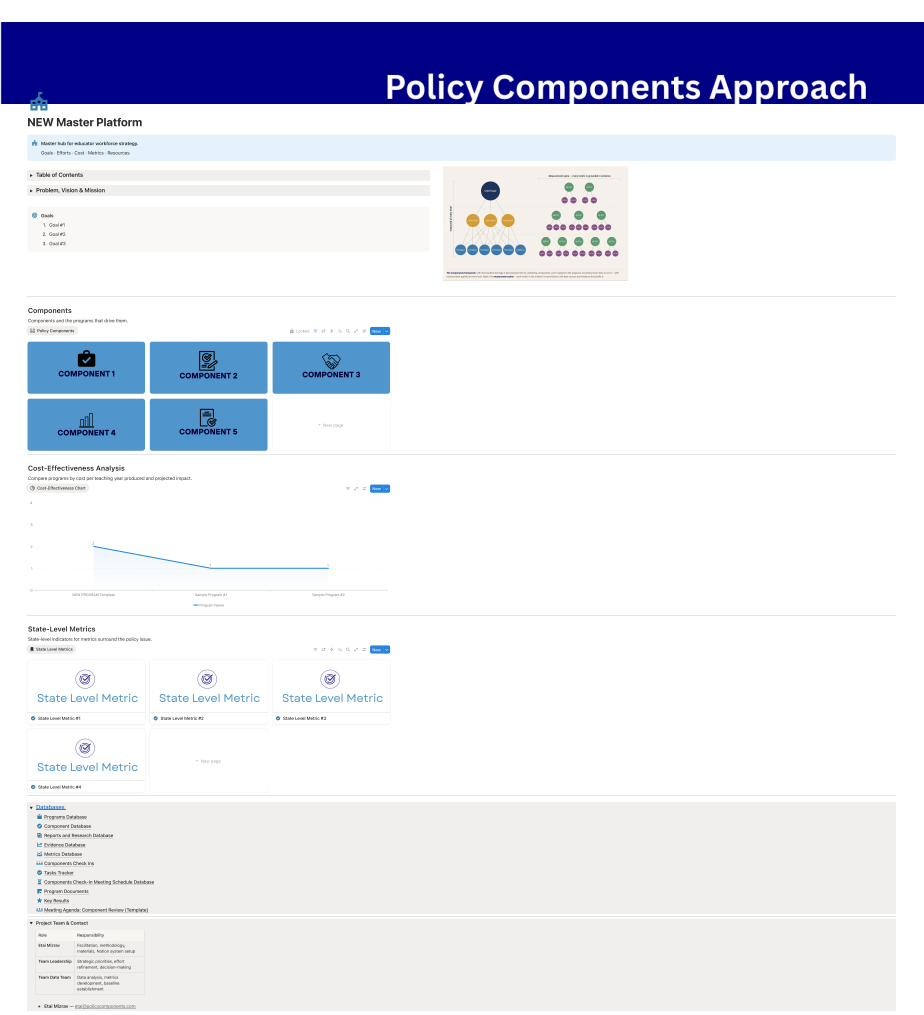
Reading the pages that follow. Each level of the chain is shown the same way: a database view listing every record at that level, followed by a single record opened to show its full set of properties. The order below — components, programs, metrics, evidence, decisions — follows the same sequence as the operating-system diagram in Section 05.
Components
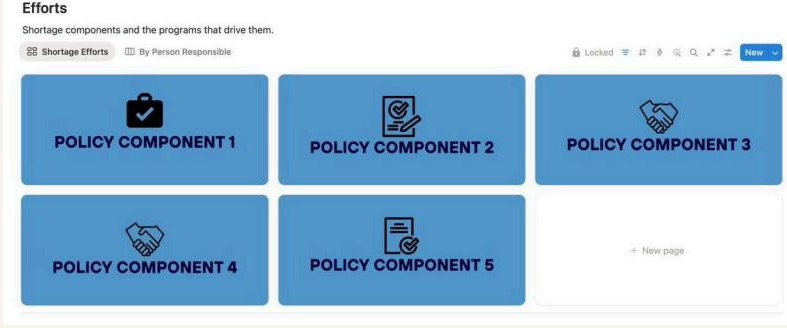
Each component identified through the decomposition described in Section 02 has its own record. A gallery view lists every component as a card; opening a card surfaces its strategic goal, priorities, linked programs, cost-effectiveness analysis, evidence, tasks, and check-in history in one place.
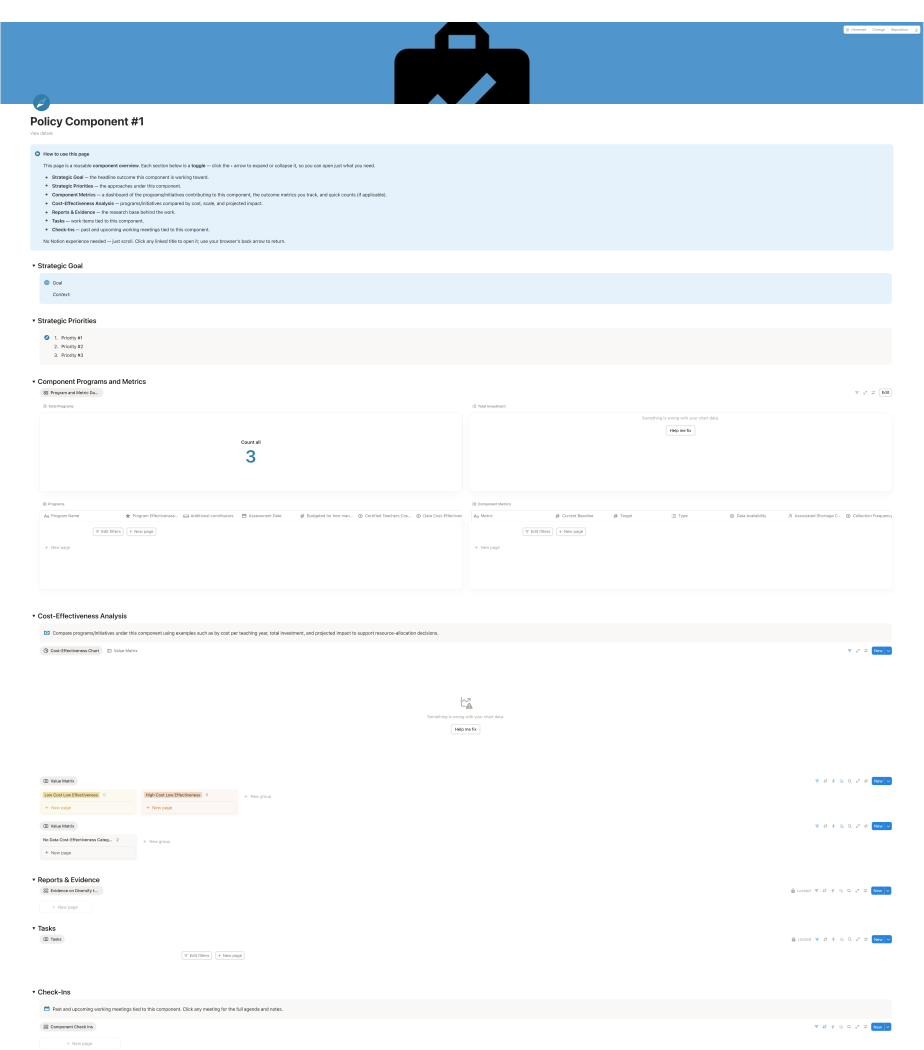
A component page is organized in the same order as a check-in agenda: goal and priorities first, then the metrics and programs that bear on it, then the cost-effectiveness analysis, then the supporting evidence, then open tasks and the meeting history. Nothing about the page requires Notion experience to read — every linked title opens the underlying record.
Programs
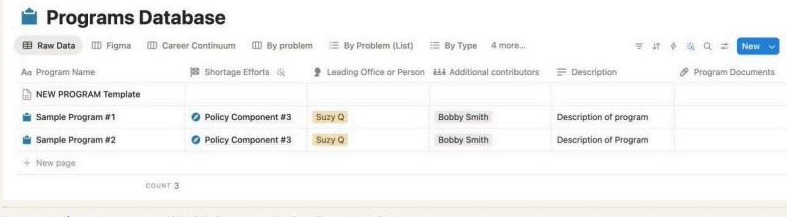
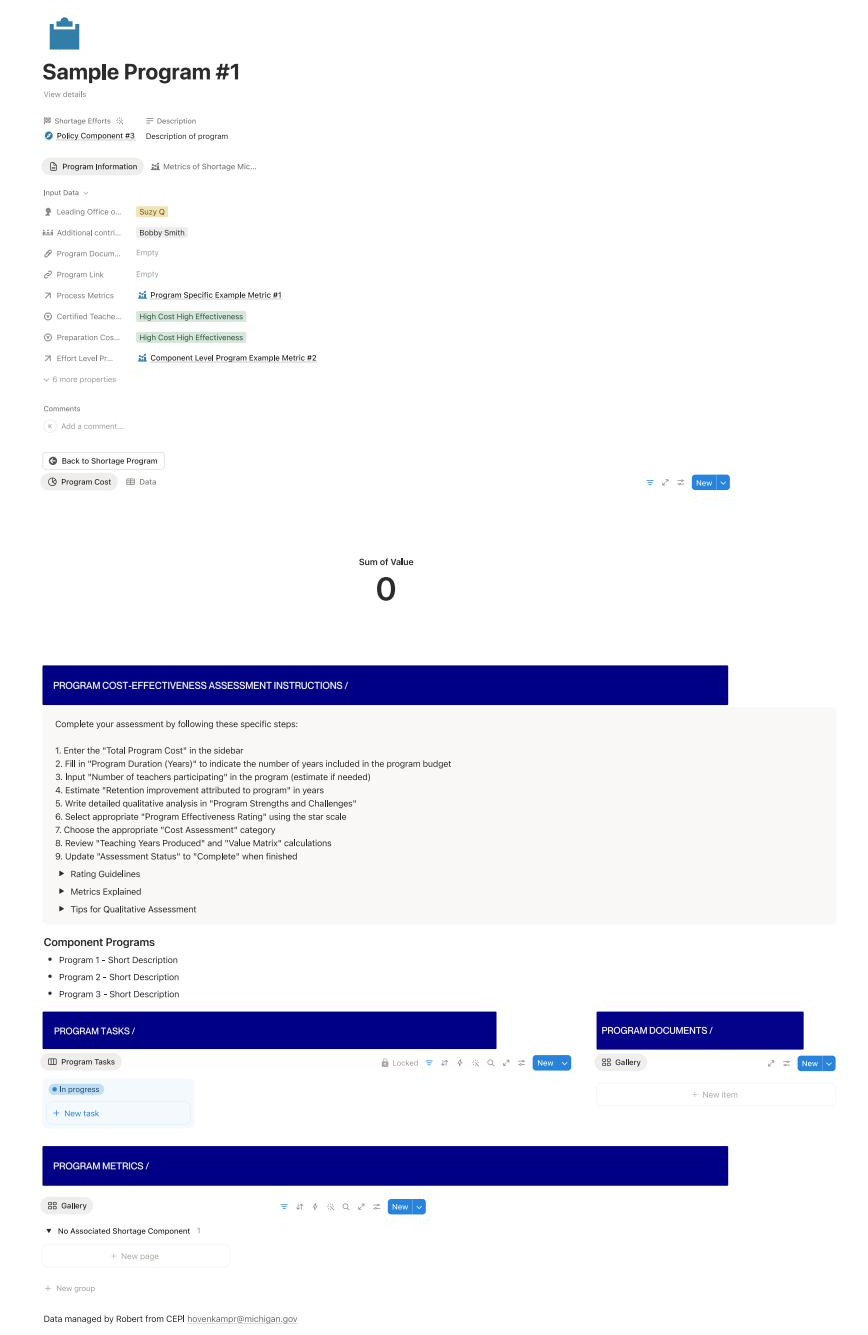
Programs are the interventions mapped to a component. The programs database lists every program alongside its leading office, contributors, and linked component; each program's own page carries a structured cost-effectiveness assessment, with instructions for completing it consistently across the workspace.

Metrics
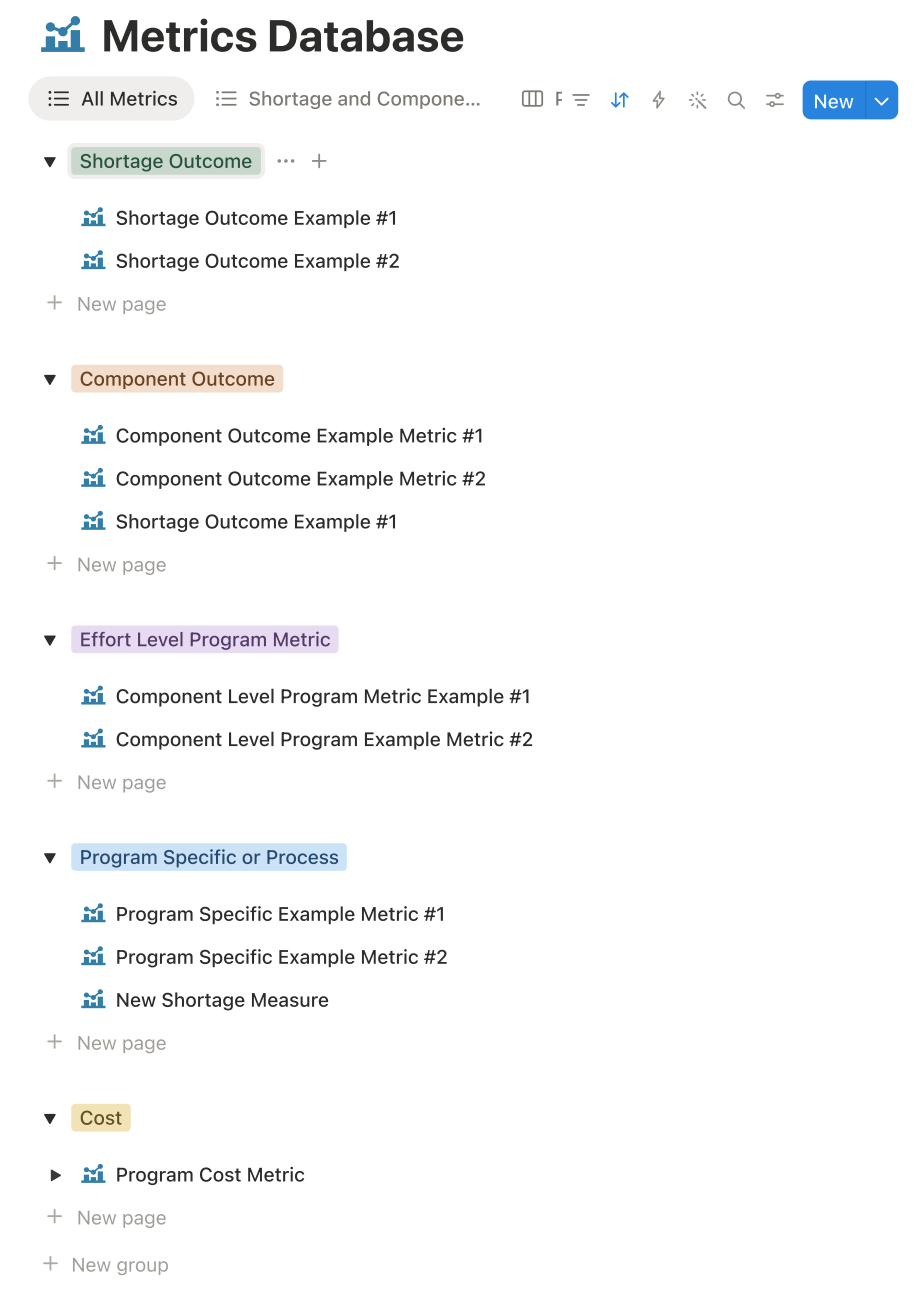
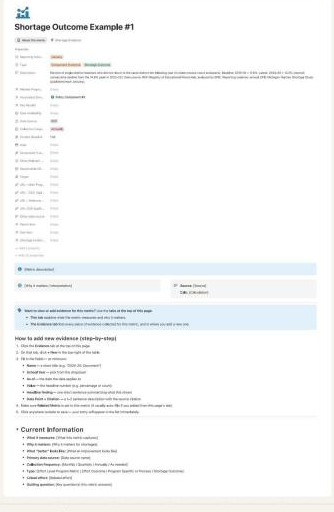
The metrics layer tracks whether the conditions behind each component are changing. Metrics are grouped by type — shortage outcome, component outcome, effort-level program metric, program-specific, and cost — and each metric carries its own baseline, target, data source, and collection frequency.
Evidence
Every metric is backed by a source. The reports and research database captures the underlying studies and memos; the evidence database holds the specific findings pulled from them, each linked back to a component and a metric. A standard template guides how new sources are logged.


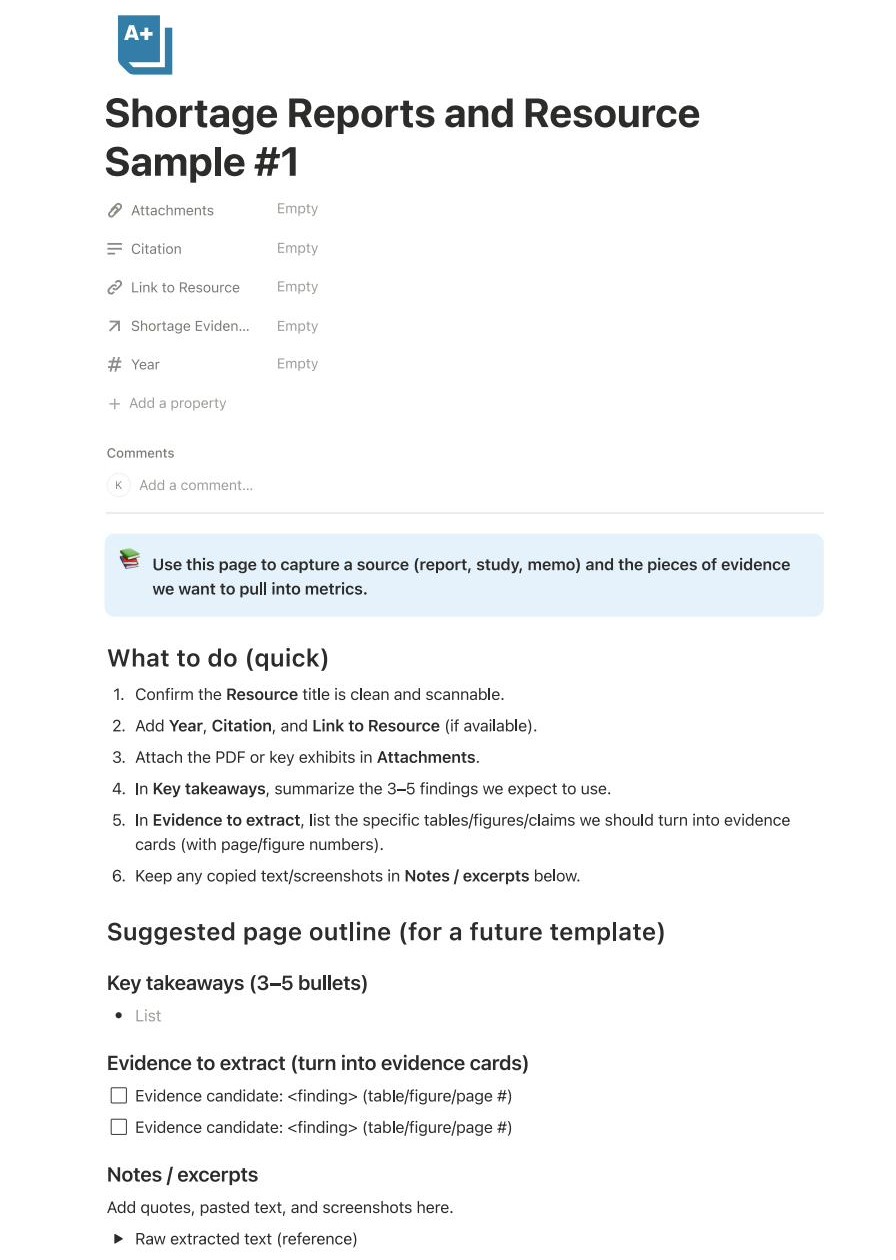
The checklist on a source record exists to keep extraction consistent: confirm the title, attach the document, summarize three to five findings, and list the specific tables or figures to convert into evidence cards before any number reaches a metric page.
Decide
The chain ends in a recurring decision point. The components check-in database logs every working meeting tied to a component; each meeting follows a fixed agenda — recap, evidence and metrics review, program discussion, synthesis, and recorded decisions — so the reasoning behind a decision stays attached to the record.
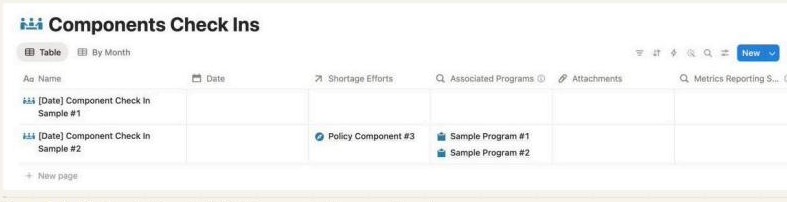

The agenda is built to close the loop described in Section 03: it opens with what changed since the last check-in, reviews the metrics and evidence directly, and closes by recording decisions, owners, and the next check-in's focus — so the same structure that organizes the workspace also organizes the conversation about it.